NMR has one feature that is not shared by any other form of spectroscopy, or chromatography – it is inherently quantitative. This means that the NMR resonance has an intensity that is directly proportional to the number of nuclei causing the resonance. Optical spectroscopies require a knowledge of the extinction coefficient or how strongly a functional group or a molecule adsorbs light to make quantitative assessments of the composition of a given material. Chromatography requires calibrations curves made from a series of solutions that vary in the concentration of the analyte to be measured to calibrate their detectors. In an NMR spectrum, all nuclei of the same type will have resonances intensities that are proportional to their abundance. This is true whether the nuclei are in the same molecule or in multiple molecules.
The intensity of an NMR signal depends entirely on the magnitude of the equilibrium magnetization M0 that arises from placing the sample into a static magnetic field. In order to derive that magnitude for spin ½ nuclei one has to write down the Boltzmann factor for the two possible spin states.
![]()
According to the “fundamental equation of NMR” the energy difference between the α and the β state is given by Planck’s constant times the Larmor frequency of the nucleus.
![]()
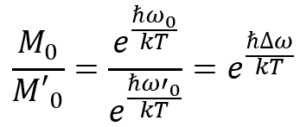
If we want to compare the equilibrium magnetization of one particular signal M0 with that of second signal M’0 we write down the ratio of the individual Boltzmann factors, which gives us an expression that depends on the frequency difference of the two NMR signals.

Hence, the equilibrium magnetizations of two nuclei do actually differ depending on their resonance frequencies. But let’s do some math to see how “bad” it really is…We’ll assume a worst case scenario and set Δω to 500 kHz and the temperature to 298 K:
![]()
Hence, the “error” is less than 10-7 for our worst-case scenario, for typical NMR spectra it is even smaller – definitely enough to qualify NMR as a primary ratio method.
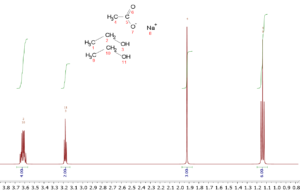
So, in a spectrum of ethanol, CH3CH2OH, there will be three resonances due to the three different types of hydrogens, and the intensities will be 3:2:1. In a 2:1 mixture of ethanol and sodium acetate, CH3COONa, the relative intensities would be 6:4:2:3 where the acetate methyl group would have an intensity of 3.

Because of this quantitative feature of NMR, it is a simple matter to determine the relative amounts of substances in a mixture; their relative concentrations can be determined by a simple ratio of the intensities of their peaks corrected for the number of identical nuclei causing the peak. So, in the ethanol/sodium acetate example given above one simply needs to normalize the intensities by dividing them by the number of hydrogens they represent. The acetate methyl peak has an intensity of 3 and three protons, so division by 3 gives 1 for the normalized intensity. The ethanol methyl, methylene, and hydroxy have intensities of 6, 4, and 2 which when normalized all give 2. Hence, the ethanol to sodium acetate ratio is 2:1. This simple example can be extended to much more complicated mixtures. In fact, quantitative NMR allows for simultaneous quantitation of multiple mixture constituents based on one sole reference standard. More importantly, the standard doesn’t have to share identity with any of the analytes of interest. This key feature makes quantitative NMR an extremely versatile technique, and enables quantitation of chemical species that could be considered rare or in short supply.
A primary method of measurement is a method having the highest metrological qualities, whose operation can be completely described and understood. For a primary method, a complete uncertainty statement can be written down in terms of SI units. As such, quantitative NMR spectroscopy is a primary ratio method, measuring the value of a ratio of an unknown to a standard of the same quantity. Its operation can be completely described by a measurement equation.
In addition to relative quantitation, absolute determinations, such as the purity of substances, can be determined by weighing a standard of known purity into a solution containing the known weight of the analyte. NMR provides the most universally applicable form of direct purity determination without need for reference materials of impurities or the calculation of response factors but only exhibiting suitable NMR properties. Since both materials are in the same solvent, the relative molar concentrations can easily be determined. With the knowledge of the MW of both components, determination of the weight percent of the analyte can be made. That NMR-determined weight and the known weight used to make the solution, are used to give the purity of the analyte.
The same determination can be made with separate solutions of the reference standard and the analyte, but in that case the concentrations of the two materials must be known not just the weights. This so-called external reference method is usually slightly less accurate and precise because in addition to the errors from weighing, one encounters volume measurement errors.
To assess how quantitative NMR is, the largest error in the purity measurements can be shown to be sample weighing even when a 5 or 6-place balances are used.
Are calibration curves ever used in NMR? Yes, there are some rare, special applications when a calibration curve is needed. One example would be when you have an analyte of unknown MW, such as a polymer, that is appearing as a contaminant in a solution of another polymer. If a sample of the contaminating polymer is available, a calibration curve made from different weights of this material can be constructed that will give the weight% of the contaminant.
The occasional use of calibration curves defines the difference between validation of linearity in the compound-specific method versus the validation of linearity of the instrument as part of the performance qualification. In chromatography, every method is compound-specific and requires calibration curves for validation of linearity. Because the NMR instrument is more akin to an analytical balance (for qNMR applications), the validation of linearity can in general be done as part of the instrument performance qualification (i.e., based on the acceptable target measurement uncertainty and its dependence on the Signal/Noise ratio). For the method, itself, it should then be sufficient to verify that the S/N of the measured signals meet the PQ specifications (i.e., performing a standard 1H sensitivity test as a system suitability test and determining the S/N of the relevant signals in the test sample).
Another question that is sometimes asked by people very familiar with chromatography, but less familiar with NMR, is whether the current measurement is contaminated by the prior measurement. This is easily possible with chromatography were samples are successively injected onto the same column. It is not possible in NMR since every sample is placed in its own NMR tube. Cross contamination could only occur during sample preparation and, if it did, would be an example of poor laboratory practices.
In summary, NMR is an inherently quantitative technique that does not need calibration curves except for special cases.
By the Valid NMR committee (Joseph Ray, Torsten Schönberger, Michael Maiwald, Kristie Adams, Dan Sorensen, Claudia Boot, José Napolitano, Christoph Freudenberger, Elina Zailer)
